
State of the Criminal Justice System - 2019 Report
Results by outcome
This report presents data on selected indicators that were included based on noteworthy findings and available data.Footnote 7 The Dashboard presents additional data. Some indicators had data for only one year and therefore no baseline was available to compare the data. Charts are included for selected indicators.Footnote 8
Outcome 1 – Canadians are safe and individuals and families feel safe
Ensuring that individuals, families, and communities in Canada are safe is a core outcome of the CJS. Crime prevention and intervention, which aims to protect individuals, families, and communities, can achieve safety. This outcome is measured by the prevalence and severity of police-reported crime, self-reported victimization, and satisfaction with personal safety from crime. Other indicators, such as crime prevention programs and community safety plans, may be included in future editions of the Framework.
Police-reported crime
In 2017, police in Canada reported over 1.9 million Criminal Code incidents (excluding traffic offences) (Allen, 2018). At a rate of 5,334 incidents per 100,000 population, the 2017 police-reported crime rate, which measures the volume of crime, increased for the third consecutive year (Chart 1).Footnote 9 At the same time, the Crime Severity Index (CSI), which measures both the volume and severity of police-reported crime, also increased for the third consecutive year, from 71.7 in 2016 to 72.9 in 2017.Footnote 10 Despite these increases, both the police-reported crime rate and the CSI have decreased substantially from a decade earlier in 2007 (-23% and -24%, respectively). In addition, both the violent crime rate and the violent CSI have decreased over the last decade (-19% and -18%, respectively).
In 2017, most crime was non-violent, accounting for four out of five (79%) police-reported Criminal Code incidents (excluding traffic) (Allen, 2018). The most common crimes included theft of $5,000 or under (non-motor vehicle), mischief, administration of justice offences (AOJOs),Footnote 11 assault level 1,Footnote 12 and breaking and entering. Rates for most crimes decreased between 2007 and 2017, although increases were seen for child pornography,Footnote 13 extortion, firearm offences, AOJOs, fraud, and sexual assault level 1 and level 3.Footnote 14
Homicides account for a small proportion of all police-reported violent Criminal Code offences in Canada (less than 0.2% in 2017) (Allen, 2018). While homicide continues to be a relatively rare occurrence in Canada, homicide rates are considered benchmarks for levels of violent activity. Police reported 660 homicides in 2017, 48 more than the previous year. The 2017 homicide rate (1.80 victims per 100,000 population) was 7% higher than the previous year, the highest in nearly a decade (Beattie, David, & Roy, 2018). The increase in homicides was driven by an increase in firearm and gang-related homicides. The 2017 firearm-related homicide rate was the highest in 25 years and the 2017 gang-related homicide rate was the highest rate recorded since comparable data was first collected in 2005.
Police-reported data show that young adults aged 18 to 24 have the highest rates of criminal offending compared with other age groups (Allen, 2016). In 2014, crime rates were highest among young adults (5,428 per 100,000 young adults), followed by youth aged 12 to 17 (4,322 per 100,000 youth). Rates for both young adults and youth were more than twice as high as the rate for adults aged 25 and older (2,048 per 100,000 adults aged 25 and older).
In 2017, the youth Crime Severity Index (YCSI), which measures both the volume and severity of crimes involving youth accused (both charged and not charged), increased 3% from the previous year, the first notable increase since 2007 (Allen, 2018). Both the police-reported youth crime rate and YCSI have decreased considerably over the last decade, since 2007 (-44% and -38%, respectively).
Police-reported data show that females are accused of criminal offending at a lower rate than males, regardless of their age. In 2017, females accused of a criminal offence accounted for 25% of all persons accused compared with 75% for males accused of a criminal offence (Savage, 2019).
Chart 1. Police-reported crime rate and Crime Severity Index, Canada, 2007 to 2017

Note: The crime rate is based on Criminal Code incidents, excluding traffic offences. The Crime Severity Index (CSI) is based on Criminal Code incidents, including traffic offences, as well as other federal statute violations. The base index was set at 100 for 2006 for Canada. Populations are based upon July 1st estimates from Statistics Canada, Demography Division.
Source: Statistics Canada. Table 35-10-0177-01 Incident-based crime statistics, by detailed violations; Statistics Canada. Table 35-10-0026-01 Crime severity index and weighted clearance rates.
Chart 1. Police-reported crime rate and Crime Severity Index, Canada, 2007 to 2017 - Text version
This line chart presents the police-reported crime rate and Crime Severity Index in Canada from 2007 to 2017.
The chart shows two lines: The blue line represents the crime rate and the orange line represents the Crime Severity Index.
The horizontal (x) axis presents the years 2007 to 2017. The vertical (y) axes present the crime rate per 100,000 population on the left, from 0 to 8,000, and the Crime Severity Index on the right, from 0 to 105.
The lines show that, over time, both the crime rate and Crime Severity Index have decreased.
The crime rate decreased from 6,908 per 100,000 population in 2007 to 5,334 per 100,000 population in 2017. The Crime Severity Index decreased from 95 in 2007 to 73 in 2017.
Self-reported victimization
Police-reported crime statistics represent only a part of all crimes.Footnote 15 The General Social Survey (GSS) on Canadians’ Safety (Victimization) collects information on victims’ self-reported experiences with crime, which includes incidents that may not have been reported to police. In 2014, just under one in five Canadians aged 15 years and older (approximately 5.6 million people) reported that they or their household had been the victim of a crime in the previous year, down from just over one in four in 2004 (Perreault, 2015).Footnote 16 About two-thirds (65%) of crimes reported by Canadians in 2014 were non-violent. Theft of personal property was the crime most frequently reported (34%), followed by physical assault (22%), theft of household property (12%), sexual assault (10%), vandalism (9%), break and enter (7%), theft of motor vehicle or parts (4%), and robbery (3%).
The rate of violent victimization (76 violent incidents per 1,000 people), which includes sexual assault, robbery, and physical assault, was 28% lower in 2014 than in 2004 (Perreault, 2015). Among the different types of violent crime, robbery and physical assault decreased from 2004 (-45% and -36%, respectively), while sexual assault was the only crime for which the victimization rate remained relatively stable since 2004.
Males and females (aged 15+) have shown similar rates of violent victimization in the past; however, in 2014, a higher rate was observed for females than males (85 incidents per 1,000 females vs. 67 incidents per 1,000 males) (Perreault, 2015). This can be explained by the stable rate of sexual assault since 2004 (a crime in which the majority of victims are female) and the significant drop in rates of robbery and physical assault (crimes in which the majority of victims are male). Overall, since 2004, rates of violent victimization have declined for both females and males. Research into the risk of violent victimization among males and females shows that females have about a 20% higher risk of violent victimization than males even when controlling other risk factors (Perreault, 2015). Victimization data for Indigenous people and marginalized and vulnerable people are reported under outcomes 8 and 9.
Satisfaction with personal safety from crime
Among Organisation for Economic Co-operation and Development (OECD) countries, Canadians are among those who feel safest (Perreault, 2017). Only citizens of the Scandinavian countries (except Sweden), Switzerland, and Slovenia were more likely to report feeling safe. According to the 2014 GSS on Canadians' Safety (Victimization), the majority (88%) of Canadians said they were satisfied with their personal safety from crime (Statistics Canada, n.d.-a.).Footnote 17 Levels of satisfaction with personal safety from crime differ among segments of the population. A higher proportion of males than females (91% vs. 85%) said they were satisfied with their personal safety from crime in 2014. Slightly higher proportions of non-Indigenous people than Indigenous people (88% vs. 85%) and non-members of a visible minority than visible minorities (89% vs. 86%) reported being satisfied with their personal safety from crime.Footnote 18 A similar proportion of immigrants and non-immigrants (89% and 88%, respectively) said they were satisfied with their personal safety from crime.Footnote 19
Outcome 2 – The criminal justice system is fair and accessible
Ensuring the CJS is fair and accessible is a core outcome of the CJS. Fairness is defined as people being treated according to the rule of law, without discrimination, while also considering a person's individual characteristics throughout the process (e.g., past behaviours, history of victimization, mental health and substance use disorders). Access to the CJS is defined as having equal access to the information and assistance that is needed to help prevent legal issues and to help resolve such issues efficiently, affordably, and fairly. This outcome is measured by public perceptions of CJS fairness and accessibility, access to legal aid, use of the Indigenous Courtwork Program, remand/pre-trial detention,Footnote 20 and complaints against the federal correctional system. Other indicators, such as complaints against the Royal Canadian Mounted Police (RCMP), self-represented accused, and administrative segregation may be included in future editions of the Framework.
Public perception that the criminal justice system is fair and accessible
According to the 2018 National Justice Survey (NJS), 57% of Canadians said they are confident or moderately confident that the CJS is fair to all people (Department of Justice Canada, 2019). In contrast 43% of Canadians expressed a lack of confidence that the CJS is fair.Footnote 21
According to the 2018 NJS, 64% of Canadians said they are confident or moderately confident that the CJS is accessible to all people (Department of Justice Canada, 2019), while 36% of Canadians expressed a lack of confidence that the CJS is accessible.Footnote 22
Criminal legal aid applications
Legal aid services support access to justice for people who are unable to pay for a lawyer on their own. Legal aid services are funded by federal, provincial, and territorial governments. The Department of Justice Canada’s Legal Aid Program provides some funding to the provinces through contribution agreements for criminal legal aid, and to the territories through consolidated access to justice services agreements. In 2016/17, legal aid services received 340,781 criminal legal aid applications across the country (Department of Justice Canada, 2018c).Footnote 23 Over three-quarters (81%) of these were approved for full legal aid services (80% of adult applications and 94% of youth applications).
Indigenous Courtwork Program
Through the Indigenous Courtwork (ICW) Program, the Department contributes to provincial and territorial governments to assist Indigenous people in contact with the CJS (accused persons, victims, witnesses, and family members) to obtain fair, just, and culturally relevant treatment. As part of the Program, community-based Indigenous courtworkers provide information on the criminal justice process (e.g., charges, court procedures, rights and responsibilities), offer support in accessing legal resources and community services, facilitate communication with court officials, and provide the court with critical background and contextual information on the Indigenous accused person and available community resolution options. The ICW Program is delivered through a network of over 200 full-time and part-time courtworkers in over 450 communities across Canada.
In 2016/17, the ICW Program served about 77,500 clients (Department of Justice Canada, n.d.-a),Footnote 24 a 32% increase from 2013/14. This increase should be interpreted with caution as it could indicate a greater reach of the Program, but also a greater number of Indigenous people in contact with the CJS. Over three-quarters (82%) of clients served in 2016/17 were accused persons with a charge. A smaller proportion (18%) of clients were witnesses, victims, family members, or persons without a charge.
Remand/pre-trial detention
Being remanded into custody (remand)/pre-trial detention refers to temporarily detaining an adult/youth in provincial/territorial custody, while they are awaiting trial or sentencing. This contrasts with sentenced custody, the detention of an adult/youth who has already been convicted of a crime. The Criminal Code (1985, s. 515(10)) and the Youth Criminal Justice Act (2002, s. 29(2)) specify justifications for detention in custody: to ensure attendance in court, protect the public (including victims and witnesses), and maintain public confidence in the administration of justice.
Remand/pre-trial detention issues relate to the fairness of the CJS since some people remanded into custody or detained in pre-trial detention are waiting to move through the system and some have not been found guilty.Footnote 25 While remand/pre-trial detention plays a role in the protection of society and the administration of justice, increases in the percentage of people held in remand/pre-trial detention may suggest deeper systemic issues. These include issues of:
- legal rights (e.g., the presumption of innocence);
- human rights (e.g., poor conditions in detention including overcrowding and a lack of correctional programs);
- access to justice;
- a culture of inefficiency/delays; and,
- the disproportionate effect of the CJS on vulnerable and marginalized people.
On an average day in 2017/18, more adults were in provincial/territorial remand than in sentenced custody (61% vs. 39%, respectively) (Statistics Canada, n.d.-b) (Chart 2). Over the past decade, the proportion of adults in remand has exceeded the sentenced custody population and the gap has widened. A similar trend has been observed for youth. On an average day in 2017/18, more youth were in pre-trial detention than sentenced custody (60% vs. 40%, respectively) (Statistics Canada, n.d.-c).Footnote 26 The proportion of youth in pre-trial detention has exceeded the sentenced custody population since 2008/09 and the gap has widened. These trends for adults and youth show that the average count of adults and youth in sentenced custody is declining while the average count of those in remand/pre-trial detention is increasing.
Chart 2. Percentage of adults in provincial/territorial remand and sentenced custody, Canada, 2007/2008 to 2017/2018
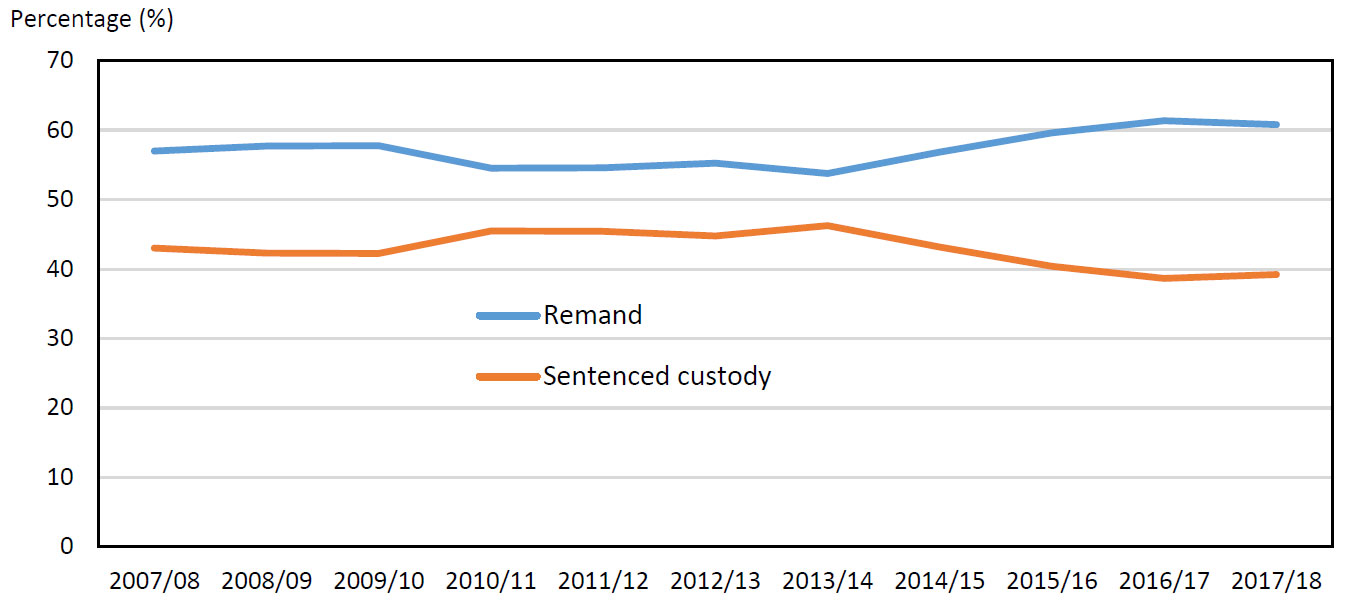
Note: Data represent the total actual-in count (i.e., persons held in custody under sentence or remand or who are otherwise legally required to be there and who are present at the time the count is taken) for all reporting jurisdictions. Data for a given year may be incomplete due to missing data for one or more jurisdictions. Alberta data are unavailable for 2013/2014. Comparison among years at the national level should be made with caution. Calculations exclude "other temporary detention" (e.g., offenders held for lock-ups, parole violations or suspensions, immigration holds), which accounts for less than 2% of adults held in custody.
Source: Statistics Canada. Table 35-10-0154-01 Average counts of adults in provincial and territorial correctional programs. Custom tabulation prepared by Department of Justice Canada.
Chart 2. Percentage of adults in provincial/territorial remand and sentenced custody, Canada, 2007/2008 to 2017/2018 - Text version
This line chart presents the percentage of adults in provincial/territorial remand and sentenced custody in Canada from 2007/2008 to 2017/2018.
The chart shows two lines: The blue line represents the percentage of adults in provincial/territorial remand and the orange line represents the percentage of adults in provincial/territorial sentenced custody.
The horizontal (x) axis presents the years 2007/08 to 2017/18. The vertical (y) axis presents the percentage (%) of adults in provincial/territorial remand and sentenced custody from 0 to 70 (%).
The charts shows that over the past decade, the percentage of adults in remand has exceeded the percentage of adults in sentenced custody and the gap has widened. The percentage of adults in remand has increased while the percentage of adults in sentenced custody has decreased.
In 2007/2008, 57% of adults were in remand compared to 61% in 2017/2018.
In 2007/2008, 43% of adults were in sentenced custody compared to 39% in 2017/2018.
Outcome 3 – Canadians understand the role of and express confidence in the criminal justice system
Ensuring that Canadians understand the role of and express confidence in the CJS is a core outcome of the CJS. Research shows that Canadians are more likely to express confidence in the CJS if they increase their awareness and understanding of the CJS through public legal education or media. This outcome is measured by public awareness of the role of the CJS, public confidence in the CJS, and by the willingness of victims to report crime. Other indicators, such as public perception that the courts are doing a good job of providing justice quickly and public confidence in correctional services may be included in future editions of the Framework.
Public awareness of the role of the criminal justice system
An important measure of the performance of the CJS is the extent to which Canadians are actually aware of the role of the CJS, namely the police, courts, and correctional services. An increase in public awareness of the role of the CJS may be linked to an increase in public confidence in the system. According to the 2018 National Justice Survey, a majority of Canadians reported being aware or moderately aware of the role of the police (88%), courts (79%), and corrections (68%) (Department of Justice Canada, 2019).Footnote 27
Public confidence in the criminal justice system
Another important measure of the performance of the CJS is the extent to which Canadians are satisfied with the work of the police, courts, and other sections of the system. For the system to be effective and for people to come forward as victims and witnesses of crime, the public must have confidence and trust in the CJS.
According to the 2014 GSS on Victimization, the majority (91%) of Canadians (aged 15+) have confidence in the police (Statistics Canada, n.d.-a).Footnote 28 This proportion increased from 83% in 2009. In 2014, public confidence in the police was higher among females than males (92% vs. 89%), and non-Indigenous people than Indigenous people (91% vs. 83%). Equal proportions of visible minorities and non-members of a visible minority reported confidence in the police (91%).
Also according to the 2014 GSS on Victimization, more than two-thirds (71%) of Canadians (aged 15+) have confidence in Canadian criminal courts (Statistics Canada, n.d.-a).Footnote 29 This proportion increased from 58% in 2009. Public confidence in criminal courts was higher among females than males (73% vs. 70%), non-Indigenous people than Indigenous people (72% vs. 65%), and visible minorities than non-members of a visible minority (77% vs. 71%).
Victimization incidents reported to police
Based on the 2014 GSS on Victimization, just under one-third (31%) of victimization incidents were reported to the police, meaning that most incidents (67%) go unreported (Perreault, 2015).Footnote 30 The proportion of victimization incidents reported to police in 2014 (31%) was unchanged from 2009, but decreased since 2004 (34%) and 1999 (37%). In general, the more serious an incident, the greater the likelihood it will be reported to police. Sexual assault is the notable exception to this trend, being the least likely crime to be reported to police in 2014 (among offences measured by the GSS) (Chart 3). Only 5%E of sexual assault incidents were brought to the attention of the police in 2014, a proportion not significantly different from that recorded a decade earlier in 2004 (8%E)Footnote 31. For other offences, reporting rates ranged from 25% for theft of household property to 50% for break and enter.
The most common reason for not reporting a criminal incident to police was that victims considered it minor and not worth taking the time to report (78%) (Perreault, 2015). Other reasons included victims feeling that the police would not have considered the incident important enough (58%), that there was a lack of evidence (52%), that police would not have found the accused person or stolen property (51%), and that the incident was a private or personal matter and was handled informally (43%). The most common reason for not reporting a sexual assault to police was that victims considered it minor and not worth taking the time to report (71%) (Perreault, 2015). Other reasons included victims feeling that the incident was a private or personal matter and was handled informally (67%), that no one was harmed or suffered financial loss (63%), and that they did not want the hassle of dealing with the police (45%).
Chart 3. Victimization incidents reported by Canadians, by reporting to the police and type of offence, 2014

Note: Excludes data from the territories. Data includes Canadians aged 15 and over. E use with caution.
Source: Perreault, S. (2015). Criminal victimization in Canada, 2014. Juristat. Statistics Canada. Catalogue no. 85-002-X.
Chart 3. Victimization incidents reported by Canadians, by reporting to the police and type of offence, 2014 - Text version
This vertical bar chart presents the percentage of reported victimization incidents by Canadians, by reporting to the police and type of offence, for 2014.
The horizontal (x) axis presents total victimization incidents and seven types of offences: break and enter, motor vehicle/parts theft, theft of household property, vandalism, physical assault, robbery, and sexual assault.
The vertical (y) axis presents the percentage (%) of reported victimization incidents.
On the far left side, the chart illustrates that 31% of total victimization incidents are reported by Canadians.
After this first bar, from left to right, the chart indicates the following proportions of incidents reported by Canadians: 50% for break and enter, 44% for motor vehicle/parts theft, 25% for theft of household property, 37% for vandalism, 38% for physical assault, 45% for robbery, and 5% for sexual assault. There is a symbol “E” above the bar for sexual assault which means use with caution.
Outcome 4 – The criminal justice system operates efficiently
Ensuring the CJS operates efficiently and that police and courts process offences promptly, and uses services and resources efficiently, is a core outcome of the CJS. This outcome is measured by the offence clearance rate, court case processing time, and administration of justice offences. Other indicators, such as court cases stayed due to systemic delay and costs of the CJS may be included in future editions of the Framework.
Offence clearance rate
One of the primary functions of the police is investigating and solving crimes. The primary way of measuring how effective the police are in performing this function is by using the weighted clearance rate. This rate represents the number of incidents police cleared by a charge or otherwise (i.e., solved) during the year as a proportion of the number of incidents during the year, and assigns higher values (“weight”) to more serious crimes.Footnote 32 In 2017, the weighted police clearance rate was 39%, a slight increase from 2007 (36%) (Statistics Canada, n.d.-d). In 2017, the police clearance rate was higher for violent offences than non-violent offences (63% and 30%, respectively). In general, police are more than twice as likely to solve violent crimes as property crimes. This is partly because victims often serve as witnesses to help identify accused persons in crimes that involve direct confrontation between a victim and offender (Hotton Mahony & Turner, 2012).
Court case processing time
The amount of time it takes to process a case through the courts is an important measure of court efficiency. Court delays are a significant concern because of increased CJS costs, the rights of accused persons, and the effect on victims of crime. The Supreme Court of Canada’s Jordan decision underscores this: A failure to provide a trial in a reasonable period violates the constitutional rights of accused persons and can result in cases, including serious charges, being dismissed (R. v. Jordan, [2016] SCC 27 1 S.C.R. 631). This can contribute to further hardship for victims and the ineffective use of CJS resources, as well as undermine public safety and public confidence in the CJS.
The median length of a case, from a person’s first court appearance to the completion of their case (court finding), measures the time it takes to process a court case. The median is the point at which half of all cases had longer case lengths and half had shorter case lengths. Compared with the mean (average), the median is less affected by outliers and skewed data (e.g., very short or long cases). In 2016/17, it took a median of 141 days (almost five months) to complete a case in adult criminal court (Chart 4) (Statistics Canada, n.d.-e). This was 12 days longer than the previous year, and 16 days longer than a decade ago in 2006/07. A similar trend was observed in youth courts: In 2016/17, it took a median of 134 days (over four months) to complete a case, nine days longer than the previous year, and 24 days longer than a decade ago in 2006/07 (Statistics Canada, n.d.-f).
Chart 4. Median length of cases completed in adult criminal and youth court, Canada, 2006/2007 to 2016/2017

Note: A case is one or more charges against an accused person or company, which were processed by the courts at the same time and received a final decision. Case length is calculated based on the number of days it takes to complete a case, from first appearance to final decision. The median is the point at which half of all cases had longer case lengths and half had shorter case lengths. Excludes cases in which the case length was unknown. Excludes information from superior courts in Prince Edward Island, Ontario, Manitoba, and Saskatchewan as well as municipal courts in Quebec due to the unavailability of data. Since some of the most serious cases are processed in superior courts, the absence of data from superior courts in these jurisdictions may result in a slight underestimation of case elapsed times as more serious cases generally require more court appearances and take more time to complete. In Quebec, the median processing time for cases in adult criminal court is overestimated since the data from municipal courts, which normally hear less serious cases, are not taken into account.
Source: Statistics Canada. Table 35-10-0029-01 Adult criminal courts, cases by median elapsed time in days; Statistics Canada. Table 35-10-0040-01 Youth courts, cases by median elapsed time in days.
Chart 4. Median length of cases completed in adult criminal and youth court, Canada, 2006/2007 to 2016/2017 - Text version
This line chart presents the median length of cases completed in adult and youth criminal court in Canada from 2006/2007 to 2016/2017.
The chart show two lines: The blue line represents the median length of cases completed in adult court and the orange line represents the median length of cases completed in youth criminal court.
The horizontal (x) axis presents the years 2006/07 to 2016/17. The vertical (y) axis presents the median length of cases in days from 0 to 160.
The length of youth cases remain lower than the length of adult cases from 2006/2007 to 2016/2017.
In 2016/2017, it took a median of 141 days (almost 5 months) to complete a case in adult criminal court. This was 12 days longer than the previous year, and 16 days longer than a decade ago in 2006/2007.
A similar trend was observed in youth courts: In 2016/2017, it took a median of 134 days (over 4 months) to complete a case, 9 days longer than the previous year, and 24 days longer than a decade ago in 2006/2007.
Administration of justice offences
Administration of justice offences (AOJOs) include the Criminal Code violations of failure to comply with conditions/an order, breach of a probation order, failure to appear at court, escape or help escape from custody, prisoner unlawfully at large, and other offences relating to justice administration (for example, impersonating a peace officer). These type of charges represent one of the most frequent offences in criminal court. The effect of charges for AOJOs is important to the overall efficiency of the CJS because the volume puts additional pressure on the system by diverting resources from more serious crimes and contributing to additional delays in case processing times. Monitoring trends in AOJOs can provide insight into the effectiveness of the CJS because these trends may highlight where conditions and supervision approaches are not working well and where conditions may be inappropriately applied. AOJOs are described as part of the “revolving door” of the CJS, as setting people up to fail, and placing unnecessary or overly broad release conditions on people that have a disproportionate effect on vulnerable and marginalized populations (Burczycka & Munch, 2015; Canadian Civil Liberties Association and Education Trust, 2014).
In 2016/17, an AOJO was the most serious offence in almost one in four (23%) cases in adult criminal court and 11% of cases in youth court (Statistics Canada, n.d.-g; Statistics Canada, n.d.-h). These proportions have remained stable over the past decade. Failure to comply with an order and breach of probation made up the majority of AOJO cases in adult court in 2016/17 (42% and 39%, respectively). In youth court, the majority (67%) of these cases included failure to comply with an order.
Outcome 5 – The criminal justice system promotes and supports diversion, restorative justice, Indigenous justice, and tools for community-based resolution
Ensuring victims, survivors, accused, convicted persons, and families have multiple options available to address crime, either through community-based or culturally-based options, where appropriate, or the formal CJS, when necessary, is a core outcome of the CJS. This outcome is measured by the use of incarceration,Footnote 33 diversion,Footnote 34 and drug treatment courts.Footnote 35 Other indicators such as referrals to restorative justice programs,Footnote 36 Indigenous justice programs, and specialized/therapeutic courts may be included in future editions of the Framework.
Incarceration rate
Custody is the most serious sentence handed down by Canadian courts. On an average day in 2017/18, about 39,000 adults were in provincial/territorial or federal custody (Malakieh, 2019). This translates to an incarceration rate of 131 adults per 100,000 adult population, a 4% decrease from 2016/17. On an average day in 2017/18, 792 youth were in custody, a rate of 4 per 10,000 youth population, a 12% decrease from the previous year and a 29% decrease from 2013/14.Footnote 37 The use of incarceration is not an alternative to the traditional CJS, but it remains important when exploring the use of alternatives and resolution mechanisms. The incarceration rate, a common and internationally used metric, can contextualize how the CJS responds to crime. A decrease in the incarceration rate could mean a greater use of non-custodial sentences, such as probation and alternative processes, (e.g., diversion, community-based resolution mechanisms). It could also mean a decrease in violent or other crimes leading to custodial sentences.
Incidents cleared by referral to a diversionary program
In 2017, about two-thirds (65%) of police-reported criminal incidents that were cleared by police were cleared by charge and about one-third (35%) were cleared by other means (Statistics Canada, n.d.-i).Footnote 38 Referrals to a diversionary program represented a small proportion of incidents cleared by other means (3%). Referrals to a diversionary program include cases where the accused is diverted away from the court process into a formal diversionary program, commonly referred to as “Alternative Measures or Extrajudicial Sanctions.” This proportion (3%) has remained stable over the past five years. The most common reason for clearing an incident by other means included police departmental discretion (47%).Footnote 39 The remaining one-half (50%) of incidents were cleared by other means for another reason,Footnote 40 such as the complainant declined to press charges. At the time of publication, data was only available for all incidents cleared by referral to a diversionary program and could not be separated for adults and youth.
Drug treatment courts
The relationship between illegal drug use and crime is well established and it represents a continuing and costly problem in Canada. Drug treatment courts provide judicially supervised or court-monitored addiction treatment in an effort to address some of the underlying issues that bring non-violent people before court. Drug treatment courts can be effective in directing marginalized and vulnerable populations to effective alternatives to the CJS through appropriate community treatment and support. Successful court-monitored programs operate through strong, collaborative partnerships between the court, health, and community support systems. In 2018, there were 106 people referred to a drug treatment court program federally funded by the drug treatment court funding program (DTCFP), Department of Justice Canada, and by provincial/territorial government partners (Department of Justice Canada, n.d.-b).Footnote 41 This represents a 19% increase from 2014.
Outcome 6 – The criminal justice system provides persons in the correctional system with services and supports to rehabilitate them and integrate them back into the community
Ensuring people in the correctional system are provided with services and supports so they can be rehabilitated and reintegrated into the community is a core outcome for the CJS. This outcome is measured by providing specialized treatment, services, and programs; parole eligibility; successful statutory release; securing employment before they complete their sentence; and community release plans for Indigenous people in federal custody. Other indicators, such as recidivism, healing lodges, and record suspensions/pardons may be included in future editions of the Framework. At this time, the federal correctional level is the main source of information for an account of correctional services and supports. The intent is to add indicators over time that cover adults and youth in the provincial/territorial correctional system.
Mental health services in federal corrections
The Correctional Service of Canada (CSC) is responsible for providing essential health services and reasonable access to non-essential mental health services that contribute to rehabilitation and successful community reintegration for individuals under federal correctional supervision. The CSC offers mental health screening to all people admitted to CSC under a new federal sentence to identify mental health problems and facilitate follow-up assessment and intervention. According to the CSC (2018), in 2017/18, the majority (94%) of federally incarcerated individuals with an identified mental health need received mental health services. This represented a decrease from 98% in 2013/14 (CSC, 2014). Mental health services ranged from psychological counselling to crisis intervention for self-injurious behaviour. They were provided by an interdisciplinary team of mental health professionals, including psychologists, social workers, occupational therapists, and nurses.
Correctional programs in federal corrections
Correctional programs contribute to public safety through assessment activities and program interventions for individuals under federal correctional supervision to assist their rehabilitation and facilitate successful community reintegration. Federal correctional programs are available for men, women, Indigenous men, and Indigenous women. These programs are designed to target specific risk and need factors demonstrated to be linked to reoffending (e.g., low levels of education and employment, mental health and addictions issues, criminal associates). In 2017/18, more than three-quarters (83%) of individuals under federal correctional supervision with an identified need completed a nationally recognized correctional program before their sentence ended, a decrease from 95% in 2013/14 (CSC, 2018; CSC, 2014).
Educational programs in federal corrections
The goal of correctional educational programs is to help improve the literacy, academic and personal development skills of individuals under federal correctional supervision to support their rehabilitation and reintegration into the community. These programs lead to formal recognition, certification, or accreditation from a recognized educational authority. In 2017/18, about two-thirds (67%) of individuals under federal correctional supervision with an identified educational need upgraded their educational qualifications before their sentence ended, an increase from 58% in 2013/14 (CSC, 2018; CSC, 2014).
Community release plans for Indigenous people in federal custody
Implemented in 1992 to address the overrepresentation of Indigenous people in federal institutions and increase the likelihood of positive outcomes for Indigenous people post-release, section 84 of the Corrections and Conditional Release Act (CCRA) (1992) requires the CSC to involve Indigenous communities in planning for the release of Indigenous people from custody. In 2017/18, less than one-half (44%) of Indigenous people in custody had a CCRA Section 84 release plan, about the same percentage as in 2015/16 (CSC, 2018).
Outcome 7 – The criminal justice system respects victims’ and survivors’ rights and addresses their needs
Ensuring the CJS respects victims’ and survivors’ rights and addresses their needs is a core outcome for the CJS. This outcome is measured by how satisfied victims/survivors are with the system and by whether they participate in the system. The low number of indicators under this outcome underscores the need to improve data collection and reporting efforts for victims’ and survivors’ rights and needs. Other indicators, such as victims assisted by victim services agencies, criminal injuries compensation and financial benefits programs, and restitution orders, may be included in future editions of the Framework.
Victims’ satisfaction with actions taken by police
In 2014, about two-thirds (66%) of victims of violent crime who reported an incident to police were satisfied with the actions taken by police (Statistics Canada, n.d.-a).Footnote 42 This percentage remained relatively stable across the past three iterations of the survey (1999, 2004, and 2009).
Victims registered so they can receive information about the person who harmed them
Under the Canadian Victims Bill of Rights (2015), victims have the right, on request, to some general information about the CJS as well as to certain case-specific information. The Corrections and Conditional Release Act (1992) provides victims with the right to certain information pertaining to the person who harmed them in cases where the convicted person is under the federal correctional system. The Correctional Service of Canada (CSC) and the Parole Board of Canada (PBC) do not automatically provide information, to respect victims who do not wish to be informed and to comply with privacy law. Victims who register with the CSC or PBC can obtain information about the status of the person who harmed them, their progress in their correctional plan, copies of PBC decisions, and CSC’s victim-offender mediation services, among other information.Footnote 43 In 2018/19, 8,367 victims were registered with the CSC or PBC to receive information about the person who harmed them, up from 6,594 in 2010/11 (Parole Board of Canada, n.d.).
Outcome 8 – The criminal justice system reduces the number of Indigenous people in the system
Indigenous people have historically been, and continue to be, overrepresented in the CJS. This outcome links directly to the Truth and Reconciliation Commission of Canada’s Call to Action to report, monitor, and evaluate progress in eliminating the overrepresentation of Indigenous people in custody (Truth and Reconciliation Commission of Canada, 2015). Ensuring the CJS identifies the proportion of Indigenous to non-Indigenous victims/survivors and accused/convicted persons is critical to know if there has been a reduction. This outcome is measured by self-reported victimization, number of homicide victims, number of homicide accused, admissions to the correctional system, and Dangerous Offender classifications.Footnote 44 Other indicators, such as the proportion of Indigenous people at different stages of the court process and applying Gladue principlesFootnote 45 in sentencing may be included in future editions of the Framework.
Canada’s 2016 Census showed that over 1.6 million people self-identified as Indigenous (4.9% of the population) (Statistics Canada, 2017a). Indigenous people are overrepresented in the CJS both as victims/survivors and accused/convicted persons. This does not mean that they commit more crime than non-Indigenous people. Since the 1970s, numerous studies, inquiries and commissions have been undertaken, laws have been changed and programs have been established to address overrepresentation. They have highlighted four key factors that have contributed to Indigenous overrepresentation: colonialism, systemic discrimination, socioeconomic marginalization, and cultural differences. The CJS also needs to recognize the context in which the overrepresentation of Indigenous people in the CJS is occurring when looking at the data presented. The Dashboard includes a “learn more” section in the Indigenous people theme that provides more information on Indigenous people's experience with the CJS.
Self-reported victimization among Indigenous people
In 2014, a significantly higher proportion of Indigenous people than non-Indigenous people in Canada (aged 15+) reported being victimized in the previous year (28% vs. 18%) (Boyce, 2016).Footnote 46 The proportion of Indigenous people reporting being victimized declined from 2009 (from 38% in the provinces and 36% in the territories).Footnote 47 In 2014, the overall rate of violent victimization among Indigenous people was more than double that of non-Indigenous people (163 vs. 74 incidents per 1,000 people). The rate of violent victimization among Indigenous females (219E violent incidents per 1,000 people) was double that of Indigenous males (106E) and close to triple that of non-Indigenous females (81).Footnote 48
When all risk factors measured by the GSS were controlled for (e.g., age, childhood victimization, perceived neighbourhood social disorder, homelessness, drug use, mental health issues), Indigenous identity itself did not stand out as a characteristic linked to the risk of victimization (Boyce, 2016; Perreault, 2015).Footnote 49 Instead, the higher victimization rates among Indigenous people, overall, were related to the increased presence of risk factors among this group than among non-Indigenous people. However, when considering only Indigenous females, Indigenous identity itself remained a key risk factor for victimization even when controlling for the presence of other risk factors. This suggests that factors other than those measured in the analysis that place Indigenous females at a higher risk of victimization need to be considered.
Indigenous homicide victims
Indigenous people accounted for about one-quarter (24%) of all homicide victims in 2017, while representing an estimated 5% of the Canadian population (Beattie et al., 2018; Statistics Canada, 2018).Footnote 50 This proportion has remained relatively stable since 2014 (the first release of complete information about Indigenous identity for both male and female victims). In 2017, the homicide rate for Indigenous victims increased 8% from the previous year to 8.76 homicides per 100,000 Indigenous population. This rate was six times higher than for non-Indigenous people (1.42 per 100,000 non-Indigenous population).
Indigenous persons accused of homicide
In 2017, about two out of five (38%) persons accused of homicide were Indigenous, a proportion which has increased since 2014 when it was 31% (Beattie et al. 2018).Footnote 51 The rate of Indigenous persons accused of homicide in 2017 was 12 times higher than that of non-Indigenous accused persons (11.12 per 100,000 Indigenous population vs. 0.93 non-Indigenous population). This is similar to previous years where the rate for Indigenous accused persons was at least nine times higher than for non-Indigenous accused persons.
Indigenous admissions to custody
Indigenous people are dramatically overrepresented in custody relative to the general population. In 2017/18, Indigenous adults represented 4% of the Canadian adult population but accounted for 30% of provincial/territorial custody admissions and 29% of federal custody admissions (Chart 5) (Malakieh, 2019). At the same time, Indigenous youth, who represent 8% of the Canadian youth population, accounted for 49% of custody admissions (Malakieh, 2019; Statistics Canada, n.d.-j).Footnote 52 These proportions have been trending upwards for over 10 years. In 2007/08, Indigenous adults accounted for 21% of provincial/territorial custody admissions, 20% of federal custody admissions, and Indigenous youth accounted for 28% of provincial/territorial custody admissions (Malakieh, 2019; Statistics Canada, n.d.-j).
As with victimization data, the issue of overrepresentation in custody is more pronounced for Indigenous females. For example, Indigenous men accounted for 28% of adult male admissions to provincial/territorial custody in 2017/18 whereas Indigenous women accounted for 42% of adult female admissions (Malakieh, 2019).Footnote 53 At the same time, Indigenous male youth accounted for 47% of male youth admissions to provincial/territorial custody compared with 59% of Indigenous female youth admissions (Statistics Canada, n-d.-j).Footnote 54
Chart 5. Indigenous adult and youth admissions to provincial/territorial custody, Canada, 2007/2008 to 2017/2018

Note: An admission is counted each time a person begins any type of custody or community supervision program. The same person can be included several times in the admissions count where the individual moves from one type of legal status to another or re-enters the system in the same year. For adults, custodial admissions are totals of sentenced (including intermittent sentences), remand and other custodial status admissions. For adults, provincial/territorial sentenced admissions include provincial and territorial inmate admissions as well as federal inmates admitted to the provincial and territorial system prior to being transferred to a federal penitentiary. For youth, custody includes pre-trial detention, provincial director remand, and open and secure custody. The total does not necessarily represent all provinces and territories as there are variations in the availability of data for certain jurisdictions and years. Comparison among years at the national level should be made with caution. For adult admissions, data are not available for Prince Edward Island (2007/08) and Alberta (2012/13 to 2015/16). For youth admissions, data are not available for Prince Edward Island (2007/08 to 2008/09), Nova Scotia (2009/10 to 2017/18), Quebec (2011/12 to 2017/18), Saskatchewan (2007/08 to 2015/2016), and Alberta (2012/2013 to 2017/18). Data on youth admissions for Saskatchewan was added in 2016/2017 which would account for some of the increase year over year. Percentages exclude a small percentage of cases where Indigenous identity was unknown.
Source: Statistics Canada. Table 35-10-0016-01 Adult custody admissions to correctional services by Aboriginal identity; Statistics Canada. Table 35-10-0007-01 Youth admissions to correctional services, by Aboriginal identity and sex. Custom tabulation prepared by Department of Justice Canada.
Chart 5. Indigenous adult and youth admissions to provincial/territorial custody, Canada, 2007/2008 to 2017/2018 - Text version
This line chart presents the percentage of Indigenous adult and youth admissions to provincial/territorial custody in Canada from 2007/2008 to 2017/2018.
The chart shows two lines: The blue line represents Indigenous adult admissions to provincial/territorial custody, the orange line represents Indigenous youth admissions to provincial/territorial custody.
The horizontal (x) axis presents the years 2007/08 to 2017/18. The vertical (y) axis presents the percentage (%) of Indigenous adult and youth admissions to provincial/territorial custody from 0 to 60 (%).
The percentage of Indigenous youth admissions to custody remains higher than Indigenous adult admissions from 2007/2008 to 2017/2018.
The percentages of Indigenous adult and youth admissions to provincial/territorial custody have been trending upwards since 2007/2008. In 2007/2008, Indigenous adults accounted for 21% of provincial/territorial custody admissions compared to 30% in 2017/2018. In 2007/2008, Indigenous youth accounted for 28% of provincial/territorial custody admissions compared to 49% in 2017/2018.
There is a note on the chart that says Indigenous adults represented 4.1% of the Canadian adult population in 2016 and Indigenous youth represented 8% of the Canadian youth population in 2016.
Outcome 9 – The criminal justice system reduces the number of marginalized and vulnerable people in the system
Certain marginalized and vulnerable populations are overrepresented in the CJS, including Black Canadians, those with mental health and cognitive impairment, and those without housing. Ensuring the CJS identifies the proportion of marginalized to non-marginalized victims/survivors and accused/convicted persons is critical to know if there has been a reduction. This outcome is measured by self-reported victimization, police contact among people with mental health issues, visible minorities among the federal correctional population, and the federal correctional population with mental health needs. Other indicators, such as the proportion of visible minorities at different stages of the court process, and the prevalence of mental health and cognitive impairment may be included in future editions of the Framework.
Self-reported victimization among marginalized and vulnerable populations
Not everyone in Canada carries the same risk of being a victim of a violent crime. In 2014, higher rates of violent victimization were reported for a number of population groups (aged 15+) (Chart 6) (Perreault, 2015). For example, people self-identifying as homosexual or bisexual recorded a violent victimization rate three times higher than that of people who identified as heterosexual (207 vs. 69 incidents per 1,000 population). In addition, people who reported that they used drugs during the previous month recorded a rate of violent victimization more than four times higher than non-users (256 vs. 62 incidents per 1,000 population). Similarly, people with a mental health-related disability recorded a rate of violent victimization more than three times higher than that for people without a mental health-related disability (236 vs. 66 incidents per 1,000 population). Furthermore, people who experienced childhood maltreatment recorded a violent victimization rate more than double that of people who did not experience such abuse (125 vs. 55 incidents per 1,000 population). Moreover, people with a history of homelessness reported a violent victimization rate five times higher than people who had never been homeless (358 vs. 71 incidents per 1,000 population). Immigrants (44 vs. 86 incidents per 1,000 population) and visible minorities (55E vs. 80 incidents per 1,000 population) reported lower victimization rates than non-immigrants and non-members of a visible minority.Footnote 55
Chart 6. Violent victimization incidents reported by Canadians, by selected population groups, 2014

Note: Rates are calculated per 1,000 population aged 15 years and older with the exception of data for homosexuals and bisexuals which includes adults aged 18 and over. Violent victimization includes sexual assault, robbery, and physical assault. Excludes data from the territories – the survey was conducted in the territories using a different sampling design. People who report using drugs are identified as individuals who self-reported using drugs in the month preceding the survey. A mental health-related disability is an emotional, psychological or mental health condition, such as anxiety, depression, bipolar disorder, anorexia, substance abuse and others, which sometimes, often or always limits an individual's daily activities. Childhood maltreatment includes being slapped, hit on the head or pushed, as well as more serious actions such as being punched, kicked or forced into unwanted sexual activity. Homelessness includes both "strict" homelessness (i.e., having lived on the street, in a shelter) and "hidden" homelessness (i.e., couch-surfing, having to stay with friends or family because of nowhere else to go). The immigrant population excludes non‑permanent residents, who are persons in Canada on a work or study permit, or who are refugee claimants. E use with caution.
Source: Statistics Canada, General Social Survey on Victimization 2014; Perreault, S. (2015). Criminal victimization in Canada, 2014. Juristat. Statistics Canada Catalogue no. 85-002-X.
Chart 6. Violent victimization incidents reported by Canadians, by selected population groups, 2014 - Text version
This horizontal bar chart presents violent victimization incidents reported by Canadians, by selected population groups, in 2014.
The horizontal (x) axis measures a rate per 1,000 population (aged 15 and older) from 0 to 400.
The vertical (y) axis indicates fourteen population groups. From top to bottom, the rates of violent victimization for these groups are as follows:
- Homosexuals and bisexuals (207 per 1,000 population) versus heterosexuals (69 per 1,000 population);
- People who report using drugs (256 per 1,000 population) versus people who do not report drug use (62 per 1,000 population);
- People with a mental health-related disability (236 per 1,000 population) versus people without a mental health-related disability (66 per 1,000 population);
- People who experienced childhood maltreatment (125 per 1,000 population) versus people who did not experience childhood maltreatment (55 per 1,000 population);
- People with a history of homelessness (358 per 1,000 population) versus people without a history of homelessness (71 per 1,000 population);
- Visible minorities (55 per 1,000 population) versus non-members of a visible minority (80 per 1,000 population); and
- Immigrants (44 per 1,000 population) versus non-immigrants (86 per 1,000 population).
There is a symbol “E” beside the bar for non-members of a visible minority which means ‘use with caution’.
Mental health/substance use disorders and police contact
While the majority of people with mental health and addictions issues rarely come in contact with police, police contact is relatively common among this population. The reasons for contact are not necessarily criminal. They can be complex, often resulting from social and systemic factors, such as homelessness, poverty, addiction, and a lack of supports in the community. Information on police interactions with people who have a mental health or substance use disorder is important since these situations can be unpredictable and require different interventions. These interactions can also be more time-consuming, not only for the police, but for the health and social sectors as well. Therefore, it is important to understand this vulnerable population better in an effort to develop improved policing and mental health services. In 2012, about one in five (19%) Canadians (aged 15+) who reported having contact with police also met the criteria for a mental or substance use disorder (Boyce, Rotenberg, & Karam, 2015).Footnote 56
- Date modified: