
2017–18 Departmental Results Report
Analysis of trends in spending and human resources
Actual expenditures
Departmental spending trend (Millions of dollars)

Departmental spending trend - Text version
This stacked vertical bar graph represents departmental spending trends for six fiscal years for the Department of Justice Canada. The graph presents a timeline (in fiscal years) on the horizontal axis and amount of dollars (in millions of dollars) on the vertical axis. The timeline on the horizontal axis shows six vertical bars; one for each fiscal year from 2015-16 on the left through to 2020-21. The amount of millions of dollars on the vertical axis ranges from 0 to 800. Each vertical bar displays an accumulated total of departmental spending for three categories of funding: sunset programs – anticipated, statutory, and voted. These three categories of funding are also displayed numerically below each bar to indicate the precise dollar amount of funding for each of the six fiscal years presented.
The first vertical bar of the timeline, representing fiscal year 2015-16, displays a total of $0 for sunset programs – anticipated, $73.1 million statutory, and $610.1 million voted. The second bar of the timeline, representing fiscal year 2016-17, displays a total of $0 for sunset programs – anticipated, $70.1 million statutory, and $619.8 million voted. The third bar of the timeline, representing fiscal year 2017-18, displays a total of $0 for sunset programs – anticipated, $66.9 million statutory, and $640.1 million voted. The fourth bar of the timeline, representing fiscal year 2018-19, displays a total of $3.3 million for sunset programs – anticipated, $69.6 million statutory, and $628.2 million voted. The fifth bar of the timeline, representing fiscal year 2019-20, displays a total of $8.7 million for sunset programs – anticipated, $69.6 million statutory, and $623.8 million voted. The sixth and final bar of the timeline, representing fiscal year 2020-21, displays a total of $3.3 million for sunset programs – anticipated, $69.5 million statutory, and $629.4 million voted.
| 2015-16 | 2016-17 | 2017-18 | 2018-19 | 2019-20 | 2020-21 | |
|---|---|---|---|---|---|---|
| Sunset Programs - Anticipated | - | - | - | 3.3 | 8.7 | 3.3 |
| Statutory | 73.1 | 70.1 | 66.9 | 69.6 | 69.6 | 69.5 |
| Voted | 610.1 | 619.8 | 640.1 | 628.2 | 623.8 | 629.4 |
| TotalTable note i | 683.2 | 689.8 | 707.0 | 701.0 | 702.1 | 702.2 |
- Table note i
-
Differences may arise due to rounding.
As the primary provider of legal services to federal government departments and agencies, the Department of Justice has a Vote-Netted Revenue Authority to collect $296.2 million annually in respendable revenue. For the purpose of departmental reporting, the total amount of expenditures is reduced by the revenues received by the Department.
| 2015–16 Actual | 2016–17 Actual | 2017–18 Planned | 2017–18 Actual | 2018–19 Planned | 2019–20 Planned |
|---|---|---|---|---|---|
| 293.5 | 306.3 | 296.2 | 316.3 | 296.2 | 296.2 |
In 2017-18, $316.3 million of Vote-Netted Revenue was collected, an increase of $10.0 million compared to 2016-17. This increase is primarily due to a slight increase in revenues collected from some clients in support of government priorities, and to the change in the funding model for some initiatives. For instance, funding for the negotiation of comprehensive land claims and incremental treaty and non-treaty agreements with Indigenous groups across Canada is now under cost recovery from Crown-Indigenous Relations and Northern Affairs Canada.
| Programs and Internal Services | 2017–18 Main Estimates | 2017–18 Planned spending | 2018–19 Planned spending | 2019–20 Planned spending | 2017–18 Total authorities available for use | 2017–18 Actual spending (authorities used) | 2016–17 Actual spending (authorities used)Table note ii | 2015–16 Actual spending (authorities used) |
|---|---|---|---|---|---|---|---|---|
| Strategic Outcome 1: A Fair, Relevant and Accessible Canadian Justice System | ||||||||
| Program 1.1: Stewardship of the Canadian Legal Framework | 385,118,141 | 385,118,141 | 386,176,639 | 384,478,149 | 434,873,804 | 423,821,524 | 409,973,313 | 384,331,448 |
| Program 1.2: Office of the Federal Ombudsman for Victims of CrimeTable note iii | 1,312,105 | 1,312,105 | 1,312,105 | 1,312,105 | 1,335,012 | 1,201,148 | 1,008,746 | 1,115,554 |
| Subtotal | 386,430,246 | 386,430,246 | 387,488,744 | 385,790,254 | 436,208,816 | 425,022,672 | 410,982,059 | 385,447,002 |
| Strategic Outcome 2: A Federal Government that is Supported by High-Quality Legal Services | ||||||||
| Program 2.1: Legal Services to Government Program | 195,920,770 | 195,920,770 | 191,669,494 | 191,669,494 | 202,149,802 | 186,330,788 | 198,793,560 | 194,449,097 |
| Subtotal | 195,920,770 | 195,920,770 | 191,669,494 | 191,669,494 | 202,149,802 | 186,330,788 | 198,793,560 | 194,449,097 |
| Internal Services | 73,808,640 | 73,808,640 | 73,228,692 | 73,220,582 | 95,168,485 | 95,648,611 | 80,043,827 | 103,323,708 |
| TotalTable note iv | 656,159,656 | 656,159,656 | 652,386,930 | 650,680,330 | 733,527,103 | 707,002,071 | 689,819,446 | 683,219,807 |
- Table note ii
-
The 2016-17 expenditure split between programs and internal services is imprecise due to an oversight in the coding of a salary expenditure adjustment predominately affecting Strategic Outcome 2 with a decrease of $6.7 million and internal services with an increase of the same amount.
- Table note iii
-
The Ombudsman reports directly to the Minister of Justice, and as such, the Office falls outside of the Department’s governance framework.
- Table note iv
-
Differences may arise due to rounding.
In 2017-18, Main Estimates totaled $656.2 million and the total authorities available amounted to $733.5 million. The total authorities available include $45.8 million of funding received through the 2017-18 Supplementary Estimates processes and $31.5 million of funding from Treasury Board Secretariat Central Votes 15 and 25 (including compensation allocations and 2016-17 Operating Budget Carry Forward).
The $26.5 million variance between the total authorities available and actual spending of 2017-18 is mostly explained by anticipated expenditures related to retroactive compensation payments resulting from the expired Law Practitioner collective agreement that did not materialize in 2017-18. This increase in expenditures is expected for the Department in 2018-19 and will be reported in the 2018-19 Departmental Results Report.
The Department’s total actual spending is $707.0 million for 2017-18, representing an increase of 2.5% compared to the total actual spending for 2016-17 ($689.8 million). This increase is mainly explained by the retroactive compensation payments from various collective agreements signed and ratified in 2017-18 and by an increase in spending on Grants and Contributions programs primarily in the Victims Fund and Legal Aid programs.
Actual human resources
| Programs and Internal Services | 2015–16 Actual | 2016–17 Actual | 2017–18 Planned | 2017–18 Actual | 2018–19 Planned | 2019–20 Planned |
|---|---|---|---|---|---|---|
| Program 1.1: Stewardship of the Canadian Legal Framework | 255 | 256 | 254 | 243 | 254 | 254 |
| Program 1.2: Office of the Federal Ombudsman for Victims of Crime | 9 | 9 | 9 | 9 | 9 | 9 |
| Program 2.1: Legal Services to Government Program | 3,023 | 3,096 | 3,089 | 3,079 | 3,089 | 3,089 |
| Subtotal | 3,287 | 3,361 | 3,352 | 3,331 | 3,352 | 3,352 |
| Internal Services | 1,050 | 950 | 948 | 980 | 948 | 948 |
| Total | 4,337 | 4,311 | 4,300 | 4,311 | 4,300 | 4,300 |
Expenditures by vote
For information on the Department of Justice Canada’s organizational voted and statutory expenditures, consult the Public Accounts of Canada 2017.
Government of Canada spending and activities
Information on the alignment of the Department of Justice Canada’s spending with the Government of Canada’s spending and activities is available in the GC InfoBase.
Financial statements and financial statements highlights
Financial statements
The financial highlights presented within this DRR are intended to serve as a general overview of the Department of Justice’s Statement of Operations and Statement of Financial Position as presented in the departmental financial statements (unaudited). These statements are prepared in accordance with accrual accounting principles and are therefore different from reporting on the use of authorities, reflected in earlier sections of this report. Reconciliation between authorities used and the net cost of operations is set out in Note 3 of the departmental financial statements (unaudited).The Department of Justice Canada’s financial statements (unaudited) for the year ended March 31, 2018, are available on the departmental website.
Financial statements highlights
The financial results are shaped by the two strategic outcomes and associated internal services that aim to ensure a fair, relevant and accessible Canadian justice system and a federal government that is supported by high-quality legal services.
| Financial information | 2017–18 Planned results | 2017–18 Actual | 2016–17 Actual | Difference (2017–18 actual minus 2017–18 planned results) | Difference (2017–18 actual minus 2016–17 actual results) |
|---|---|---|---|---|---|
| Total expenses | 1,037,943,000 | 1,103,877,000 | 1,050,500,000 | 65,934,000 | 53,377,000 |
| Total revenues | 296,200,000 | 316,308,000 | 306,067,000 | 20,108,000 | 10,241,000 |
| Net cost of operations before government funding and transfers | 741,743,000 | 787,569,000 | 744,433,000 | 45,826,000 | 43,136,000 |
Planned results
Planned Results are based on the Future-Oriented Financial Statements presented in the 2017-18 Departmental Plan. The actual expenses for 2017-18 are $65.9 million higher than planned expenses due to retroactive compensation payments made in 2017-18 related to the ratification of various collective agreements and an increase in transfer payments resulting from the Budget 2017 announcement for the following areas:
- Contributions in support of the Canadian Family Justice Fund;
- Contributions to the provinces to assist in the operation of immigration and refugee legal aid; and
- Contributions under the Indigenous Justice Program Fund.
The 2017-18 actual revenues for 2017-18 are $20.1 million higher than planned revenues. This can be explained by the change in the legal services rates in 2016-17 approved by Treasury Board, which included anticipated increases to costs for Law Practitioner group collective agreements and the change of funding model for some initiatives resulting in more cost recovery from clients.
Expenses
Total departmental expenses were $1.1 billion in 2017-18, an increase of $53.4 million from 2016-17. The variance is mainly explained by the following factors:
- A decrease in severance benefit liability and expense in 2016-17 that did not re-occur in 2017-18;
- An increase in salary expenses due to retroactive compensation payments related to the ratification of various collective agreements;
- An increase in the liability for vacation pay as a result of the implementation of the Government of Canada’s Phoenix pay system; and
- An increase in transfer payments expenses as a result of increases in funding provided for the contributions to the provinces to assist in the operation of immigration and refugee legal aid and the contributions from the Victims Fund.
Expenses by Program Activity

Expenses by Program Activity - Text version
The pie chart of Expenses by Program shows the largest portion of expenses, representing 45% of the pie, falling under the Legal Services to Government Program. The wedge containing 41% of expenses is labelled Stewardship of the Canadian Legal Framework, whereas the Internal Services Program comprises 14% of the pie. The Office of the Federal Ombudsman for Victims of Crime represents less than 0.5% of expenses.
Revenues
Total departmental revenues were $316.3 million in 2017-18, a net increase of $10.2 million from 2016-17. This variance is mainly due to the change in funding model for some initiatives.
Revenues by type

Revenues by type - Text version
This pie chart portrays revenues by type. The largest section, Legal Services, represents 96% of the pie. Family Law fees account for 2%. Also referenced is 1% in Other Revenues and 1% in Common Services.
| Financial Information | 2017–18 | 2016–17 | Difference (2017–18 minus 2016–17) |
|---|---|---|---|
| Total net liabilities | 423,514,000 | 359,662,000 | 63,852,000 |
| Total net financial assets | 385,368,000 | 322,792,000 | 62,576,000 |
| Departmental net debt | 38,146,000 | 36,870,000 | 1,276,000 |
| Total non-financial assets | 38,904,000 | 33,725,000 | 5,179,000 |
| Departmental net financial position | 758,000 | (3,145,000) | 3,903,000 |
Liabilities
Total net liabilities were $423.5 million for 2017-18, an increase of $63.9 million from 2016-17. The variance is mainly due to an increase of transfer payments payable resulting from an increase in funding provided and the timing variation of financial claims submitted from year to year for the following areas:
- Contributions to the provinces to assist in the operation of the legal aid systems; and
- Contributions to the provinces to assist in the operation of immigration and refugee legal aid.
The variance is also due to an increase in the liability for vacation pay (as described above).
Liabilities by type

Liabilities by type - Text version
This pie chart is divided into five pieces. The largest piece, representing 65% of the pie, is attributed to transfer payments payable. The second largest covers 22% and represents accounts payable and accrued liabilities; the third and fourth largest pieces cover 6% each and represent employee future benefits and vacation pay and compensatory leave. The final wedge accounts for 1% of the liabilities and represents the Family Law account.
Financial and non-financial assets
Total net financial assets were $385.4 million at the end of 2017-18, an increase of $62.6 million from 2016-17. This variance is mainly because of an increase in net cash the Department is entitled to receive from the Receiver General for Canada to discharge its liabilities, especially as it relates to transfer payment programs as described above.
Total net non-financial assets were $38.9 million at the end of 2017-18, an increase of $5.2 million from 2016-17. The variance of $5.2 million is mostly attributable to an increase of leasehold improvements projects for office accommodations as well as informatics software projects. It is offset by a decrease in acquisitions of informatics hardware and furniture and furnishings resulting from changes in departmental accounting methodology related to tangible capital assets. The Department decided to no longer apply the “bulk accounting” principle for low dollar value assets and increase the capitalization threshold from $1,000 to $10,000 for the “informatics hardware” and “furniture and furnishings” assets classes. This change was made to allow for consistent treatment of all capital asset classes.
Assets by type
Assets by type - Text version
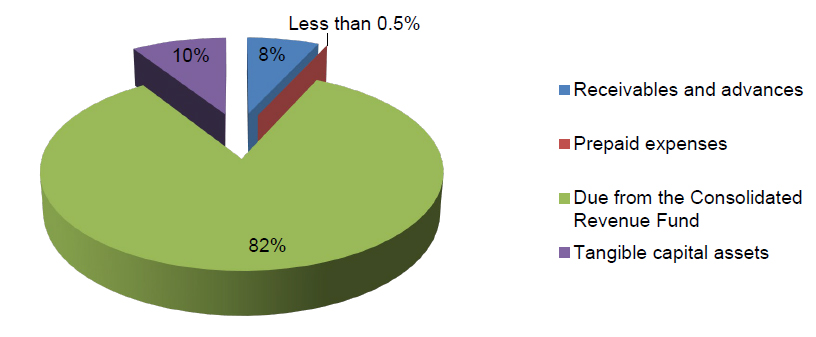
The Department's total assets are presented in a pie chart with four sections. The largest section represents the 82% of assets due from the Consolidated Revenue Fund; 10% of assets are tangible capital assets; and, 8% are receivables and advances. Also referenced is the less than 0.5% of prepaid expenses.
- Date modified: