
2019–20 Departmental Results Report
Analysis of Trends in Spending and Human Resources
Actual Expenditures
Departmental Spending Trend Graph
The following graph presents planned (voted and statutory spending) over time.
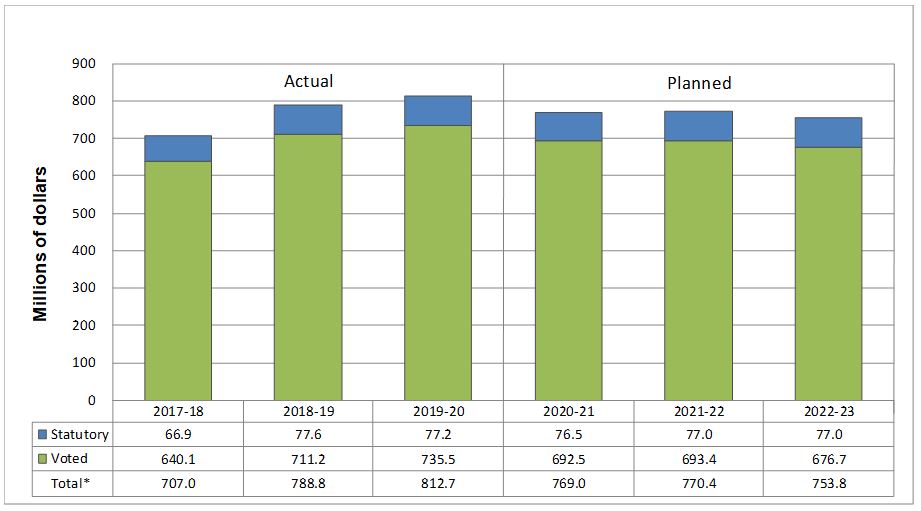
Text Version: Departmental Spending Trend Graph
This stacked vertical bar graph represents departmental spending trends for six fiscal years for the Department of Justice Canada. The graph presents a timeline (in fiscal years) on the horizontal axis and amount of dollars (in millions of dollars) on the vertical axis. The timeline on the horizontal axis shows six vertical bars; one for each fiscal year from 2017-18 on the left through to 2022-23. The vertical bars for fiscal years 2017-18 to 2019-20 show actual spending, while the bars for fiscal years 2020-21 to 2022-23 show planned spending.
The amount of millions of dollars on the vertical axis ranges from 0 to 900. Each vertical bar displays an accumulated total of departmental spending for three categories: Statutory, Voted and Total. These three categories are also displayed numerically below each bar to indicate the precise amount of spending (in millions of dollars) for each of the six fiscal years presented.
The first vertical bar of the timeline, representing fiscal year 2017-18, displays $66.9 million for statutory spending and $640.1 million for voted spending, for a total actual spending of $707.0 million.
The second bar of the timeline, representing fiscal year 2018-19, displays $77.6 million for statutory spending, $711.2 million for voted spending for a total actual spending of $788.8 million.
The third bar of the timeline, representing fiscal year 2019-20, displays $77.2 million for statutory spending, $735.5 million for voted spending for a total actual spending of $812.7 million.
The fourth bar of the timeline, representing fiscal year 2020-21, displays $76.5 million for statutory spending, $692.5 million for voted spending for a total planned spending of $769.0 million.
The fifth bar of the timeline, representing fiscal year 2021-22, displays $77.0 million for statutory spending, $693.4 million for voted spending for a total planned spending of $770.4 million.
The sixth and final bar of the timeline, representing fiscal year 2022-23, displays $77.0 million for statutory spending, $676.7 million for voted spending for a total planned spending of $753.8 million.
As illustrated in the Departmental Spending Trend Graph, the Department’s actual spending shows an increasing trend. The actual spending of $812.7 million in 2019-20 represents a 3.0% increase compared to 2018-19 ($788.8 million). The 2018-19 actual spending of $788.8 million represents an 11.6% increase compared to 2017-18 ($707.0 million).
The retroactive compensation payments and salary increases from various collective agreements that were signed and ratified in 2018-19 largely explain the increasing trend in spending from 2017-18 to 2018-19. In 2019-20, there was a drop in retroactive compensation payments, specifically in legal services. However, this decline was offset by an increase in spending, which is mainly attributable to Grants and Contributions. Footnote 6
The programs that experienced the most significant increase in spending were:
- Immigration and Refugee Legal Aid Program, which received one-time funding to address pressures and for the Enhancing the Integrity of Canada’s Borders and Asylum System initiative (Budget 2019);
- Justice Partnership and Innovation Program; and
- Legal Advice for Complainants of Sexual Harassment in the Workplace.
The Department’s planned spending displays a decreasing trend from $769.0 million in 2020-21 to $753.8 million in 2022-23. This $15.2 million decline is mainly attributable to the sunsetting of funding received under the Enhancing the Integrity of Canada’s Borders and Asylum System initiative, mainly for the Immigration and Refugee Legal Aid Program.
| Core responsibilities and Internal services | 2019-20 Main estimates |
2019-20 Planned spendingtable note i |
2020-21 Planned spending |
2021-22 Planned spending |
2019-20 Total authorities available for use |
2017-18 Actual spending (authorities used) |
2018-19 Actual spending (authorities used) | 2019-20 Actual spending (authorities used) |
|---|---|---|---|---|---|---|---|---|
| Legal Services | 194,853,652 | 194,853,652 | 210,473,297 | 213,543,076 | 231,236,873 | 180,732,263 | 243,874,771 | 223,737,181 |
| Justice System Support | 444,923,893 | 444,923,893 | 478,120,142 | 477,119,774 | 500,939,871 | 430,621,197 | 448,180,851 | 485,250,753 |
| Budget Implementation Vote – unallocated authoritiestable note ii | 26,636,730 | Not applicable | Not applicable | Not applicable | 2,680,964 | Not applicable | Not applicable | Not applicable |
| Subtotal | 666,414,275 | 639,777,545 | 688,593,439 | 690,662,850 | 734,857,708 | 611,353,460 | 692,055,622 | 708,987,934 |
| Internal Services | 78,105,514 | 78,105,514 | 80,423,780 | 79,729,341 | 102,432,854 | 95,648,611 | 96,751,723 | 103,733,100 |
| Total | 744,519,789 | 717,883,059 | 769,017,219 | 770,392,191 | 837,290,562 | 707,002,071 | 788,807,345 | 812,721,034 |
In 2019-20, the Main Estimates totaled $744.5 million and the total authorities available amounted to $837.3 million. The total authorities available include $35.7 million of funding received through the Supplementary Estimates process (mainly in relation to the Immigration and Refugee Legal Aid Program and initiatives to address sexual harassment in the workplace), as well as $57.1 million of funding related to compensation adjustments and other expenditures.
The $24.6 million variance between the total authorities available in 2019-20 of $837.3 million and the actual spending of $812.7 million is primarily explained by unspent Grants and Contributions funding Footnote 7 and the unallocated authorities for Bringing Innovation to Regulations (Budget 2019).
The Department’s 2020-21 planned spending of $769.0 million represents an increase of 7.1% compared to the planned spending for 2019-20 ($717.9 million). This increase is primarily explained by increases in expenditures relating to criminal legal aid for the provinces and territories, the Immigration and Refugee Legal Aid Program, the Justice Partnership and Innovation Program, and Legal Advice for Complainants of Sexual Harassment in the Workplace.
| Core Responsibilities and Internal Services | 2019–20 Actual gross spending | 2019–20 Actual gross spending for specified purpose accounts | 2019–20 Actual revenues netted against expenditures | 2019–20 Actual net spending (authorities used) |
|---|---|---|---|---|
| Legal Services | 519,007,218 | 0 | 295,270,037 | 223,737,181 |
| Justice System Support | 485,250,753 | 0 | 0 | 485,250,753 |
| Subtotal | 1,004,257,971 | 0 | 295,270,037 | 708,987,934 |
| Internal Services | 153,696,165 | 0 | 49,963,065 | 103,733,100 |
| Total | 1,157,954,136 | 0 | 345,233,102 | 812,721,034 |
As the primary provider of legal services to federal government departments and agencies, the Department of Justice Canada has Vote-Netted Revenue Authority to collect respendable revenue. For the purpose of departmental reporting, Vote-Netted Revenue is the total amount of expenditures reduced by the revenues received by the Department.
| Vote-Netted Revenue | 2017-18 Actual | 2018-19 Actual | 2019-20 Planned | 2019-20 Actual | 2020-21 Plannedtable note i | 2021-22 Plannedtable note i |
|---|---|---|---|---|---|---|
| Total | 316,311,782 | 330,115,613 | 327,000,000 | 345,233,102 | 327,000,000 | 327,000,000 |
In 2019-20, $345.2 million of Vote-Netted Revenue was collected, an increase of $15.1 million compared to 2018-19 ($330.1 million). This increase is primarily due to increased litigation for a broad variety of client departments and agencies, particularly in relation to legal services to support the Canada Revenue Agency’s commitment to reduce tax evasion and combat tax avoidance, and legal services to support the Canada Border Services Agency’s refugee and citizenship cases.
Actual Human Resources
| Core responsibilities and Internal services | 2017-18 Actual full-time equivalents | 2018-19 Actual full-time equivalents | 2019-20 Planned full-time equivalents |
2019-20 Actual full-time equivalents | 2020-21 Planned full-time equivalents | 2021-22 Planned full-time equivalents |
|---|---|---|---|---|---|---|
| Legal Services | 3,044 | 3,122 | 3,130 | 3,243 | 3,275 | 3,276 |
| Justice System Support | 296 | 291 | 296 | 284 | 293 | 293 |
| Subtotal | 3,340 | 3,413 | 3,426 | 3,527 | 3,568 | 3,569 |
| Internal Services | 971 | 973 | 974 | 1,043 | 1,070 | 1,070 |
| Total | 4,311 | 4,386 | 4,400 | 4,570 | 4,638 | 4,639 |
The actual full-time equivalents increased by 184 from 2018-19 to 2019-20. The most significant increases were in the Legal Services Core Responsibility and Internal Services. The full-time equivalents for the Justice System Support Core Responsibility remained relatively stable.
In relation to the Legal Services Core Responsibility, the increase of 121 full-time equivalents from 2018-19 to 2019-20 is primarily explained by increased demand for litigation for a broad variety of client departments and agencies in such areas as tax, Indigenous and immigration litigation matters. The increase of 70 full-time equivalents from 2018-19 to 2019-20 in Internal Services is mainly explained by workforce growth in Human Resources Management Services to continue managing the challenges related to the Phoenix Pay System and workforce growth in other areas providing corporate support (such as Communications Services, Information Technology Services and Real Property Management Services).
Expenditures by Vote
For information on the Department of Justice Canada’s organizational voted and statutory expenditures, consult the Public Accounts of Canada 2019–2020.
Government of Canada Spending and Activities
Information on the alignment of the Department of Justice Canada’s spending with the Government of Canada’s spending and activities is available in GC InfoBase.
Financial Statements and Financial Statements Highlights
Financial Statements
The financial highlights presented within this document are intended to serve as a general overview of the Department’s Statement of Operations and Statement of Financial Position as presented in the 2019-20 Departmental Financial Statements (unaudited). These statements are prepared in accordance with accrual accounting principles and are therefore different from reporting on the use of authorities as reflected in previous sections of this report. Reconciliation between authorities used and the net cost of operations is set out in note 3 of the 2019-20 Departmental Financial Statements (unaudited). The Department of Justice Canada’s financial statements (unaudited) for the year ended March 31, 2020, are available on the departmental website.
Financial Statements Highlights
The financial results are driven by delivering on the Department’s core responsibilities and associated internal services. The two core responsibilities aim to ensure a fair, relevant and accessible Canadian justice system and a federal government that is supported by high quality legal services.
| Financial information | 2019–20 Planned results | 2019–20 Actual results | 2018–19 Actual results | Difference (2019-20 actual results minus 2019-20 planned results) | Difference (2019-20 actual results minus 2018-19 actual results) |
|---|---|---|---|---|---|
| Total expenses | 1,124,762,000 | 1,257,033,133 | 1,207,153,970 | 132,271,133 | 49,879,163 |
| Total revenues | 327,000,000 | 344,973,410 | 330,556,030 | 17,973,410 | 14,417,380 |
| Net cost of operations before government funding and transfers | 797,762,000 | 912,059,722 | 876,597,940 | 114,297,722 | 35,461,782 |
Planned Results
Planned Results are based on the Future-Oriented Financial Statements presented in the 2019-20 Departmental Plan. The actual expenses for 2019-20 were $132.3 million higher than planned expenses, mainly due to the following:
- increased workforce, retroactive compensation payments, and in-year increments related to the ratification of various collective agreements;
- new funding received mainly for the following transfer payment programs: Immigration and Refugee Legal Aid Program, Enhancing the Integrity of Canada’s Borders and Asylum System initiative, Justice Partnership and Innovation Program, and Legal Advice for Complainants of Sexual Harassment in the Workplace; and
- accrued vacation pay due to the postponement of the automatic cash-out of vacation and compensatory leave and the impact of the additional leave days granted as per the Phoenix Compensation Agreement.
The actual revenues for 2019-20 were $17.9 million higher than planned revenues. This is explained by an increase in litigation for a broad variety of client departments and agencies.
Expenses
Total departmental expenses were $1.3 billion in 2019-20, which represents an increase of $49.9 million from 2018-19. The variance is explained by increases in the following accounts:
- new expenses for the aforementioned transfer payment programs;
- salary expenses and employee benefits related to an increase in the workforce and yearly compensation adjustments due to the ratification of various collective agreements;
- employer’s contributions to the health and dental insurance plans; and
- accrued vacation pay and compensatory leave and impacts of the Phoenix Compensation Agreement.
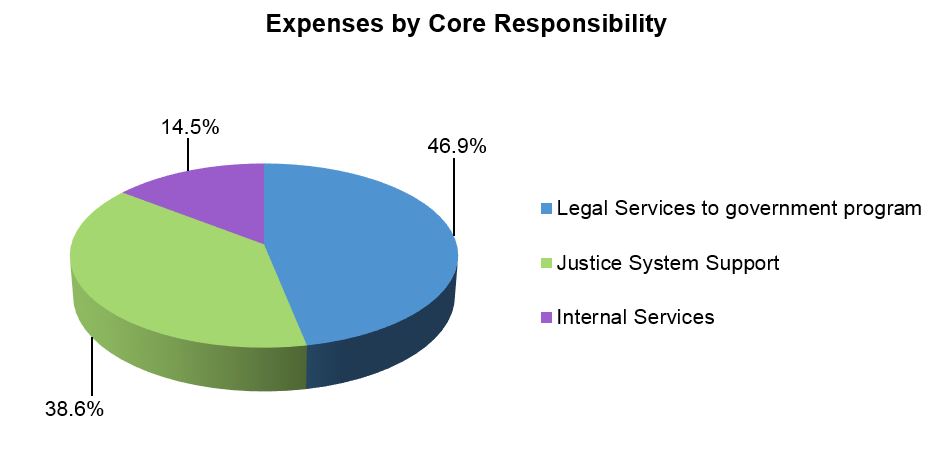
Text Version: Expenses by Core Responsibility
The pie chart of Expenses by Core Responsibility shows the largest portion of expenses, representing 46.9% of the pie, falling under the Legal Services to government program. The wedge containing 38.6% of expenses is labelled Justice System Support, whereas the Internal Services expenses comprise 14.5% of the pie.Revenues
Total departmental revenues were $344.9 million in 2019-20, a net increase of $14.4 million from 2018-19. This variance is mainly explained by an increase in litigation for a broad variety of client departments and agencies, notably the Canada Revenue Agency, the Canada Border Services Agency and Transport Canada.
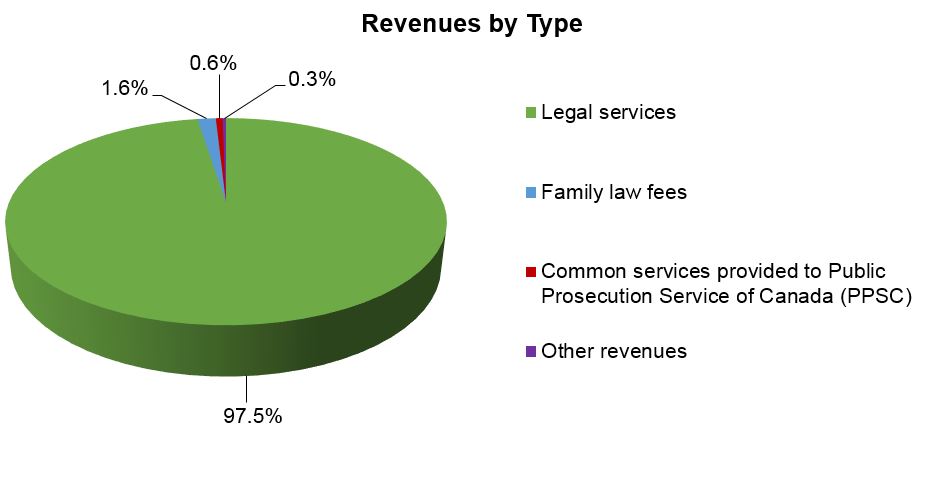
Text Version: Revenues by type
This pie chart displays revenues by type. The largest section, Legal Services, represents 97.5% of the pie. Family Law fees account for 1.6% of the pie. Also shown is 0.6% in Common Services provided to the Public Prosecution Service of Canada and 0.3% in Other Revenues.| Financial Information | 2019–20 | 2018–19 | Difference (2019–20 minus 2018–19) |
|---|---|---|---|
| Total net liabilities | 473,183,101 | 445,936,949 | 27,246,152 |
| Total net financial assets | 428,602,451 | 407,183,504 | 21,418,947 |
| Departmental net debt | 44,580,650 | 38,753,445 | 5,827,205 |
| Total non-financial assets | 38,502,452 | 44,078,979 | (5,576,527) |
| Departmental net financial position | (6,078,199) | 5,325,534 | (11,403,733) |
From 2018-19 to 2019-20, the Departmental Net Financial Position varied by $11.4 million due to a number of factors, which are reflected in the information presented below.
Liabilities
The Department’s total net liabilities were $473.2 million in 2019-20, which represents an increase of $27.2 million from 2018-19. The variance is mainly explained by an increase in:
- transfer payments payable as per new cost-shared funding obtained for legal aid programs;
- Family Law account as per a one-time supplement COVID-19 GST/HST credit payment garnishment payable to individuals in order to satisfy family support debts; and
- accrued vacation pay, compensatory leave and impacts of the Phoenix Compensation Agreement.
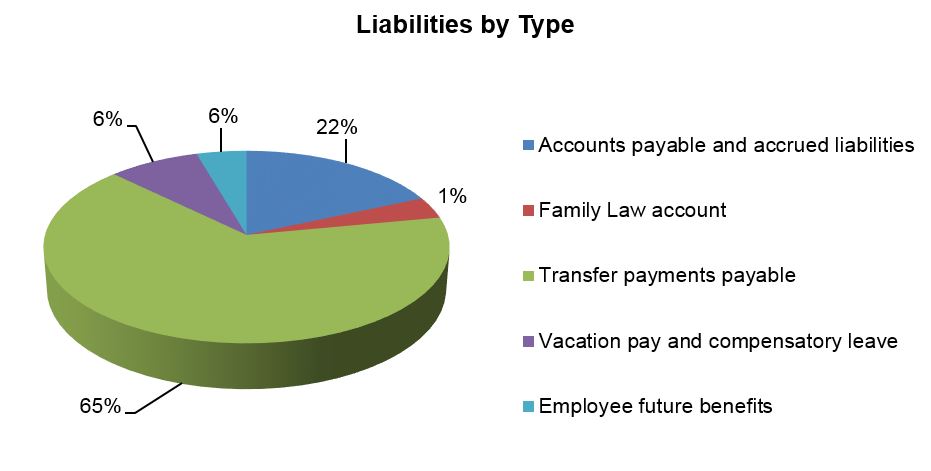
Text Version: Liabilities by Type
This pie chart displays liabilities by type. The largest section, Transfer payments payable, represents 65% of the pie. Accounts payable and accrued liabilities account for 22%. Vacation pay and compensatory leave account for 6%. Employee future benefits account for another 6%. Lastly, Family Law account represents 1%.Financial and Non-Financial Assets
Total net financial assets and non-financial assets were $467.1 million at the end of 2019-20, which represents an increase of $15.8 million from 2018-19. The variance is mainly explained by increases in:
- accounts receivable at year-end with the Canada Revenue Agency for the COVID-19 GST/HST one-time supplement garnishment payable to individuals in order to satisfy family support debts and
- accounts receivable related to salary overpayments from Phoenix;
offset by a decrease in tangible capital assets related to a write-down in leasehold improvements.
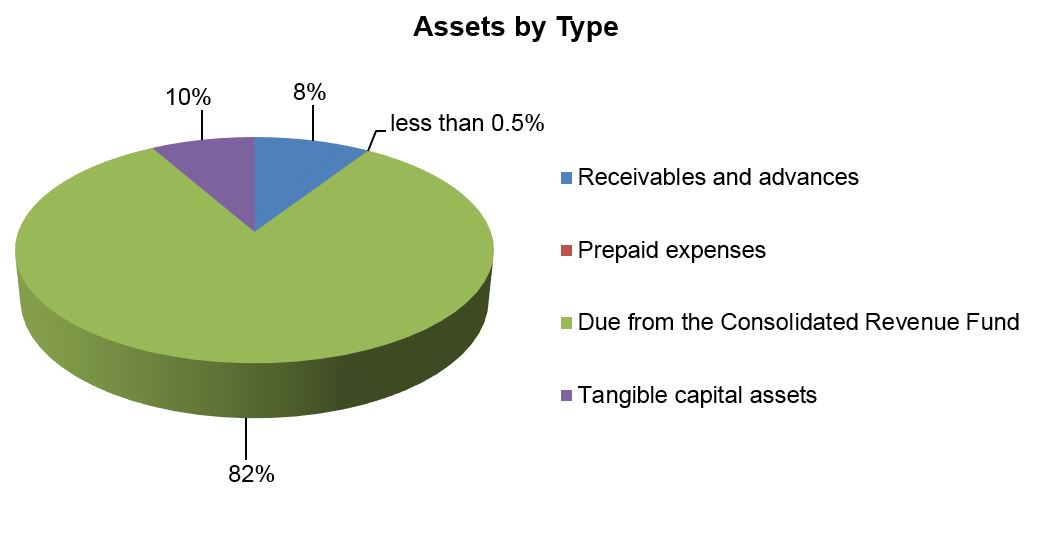
Text Version: Assets by Type
This pie chart displays assets by type. The largest section, Due from the Consolidated Revenue Fund, represents 82% of the pie. Tangible capital assets account for 10%, whereas Receivables and advances account for 8%. Lastly, Prepaid expenses represent less than 0.5%.- Date modified: