
Exploring the Link between Crime and Socio-Economic Status in Ottawa and Saskatoon: A Small-Area Geographical Analysis
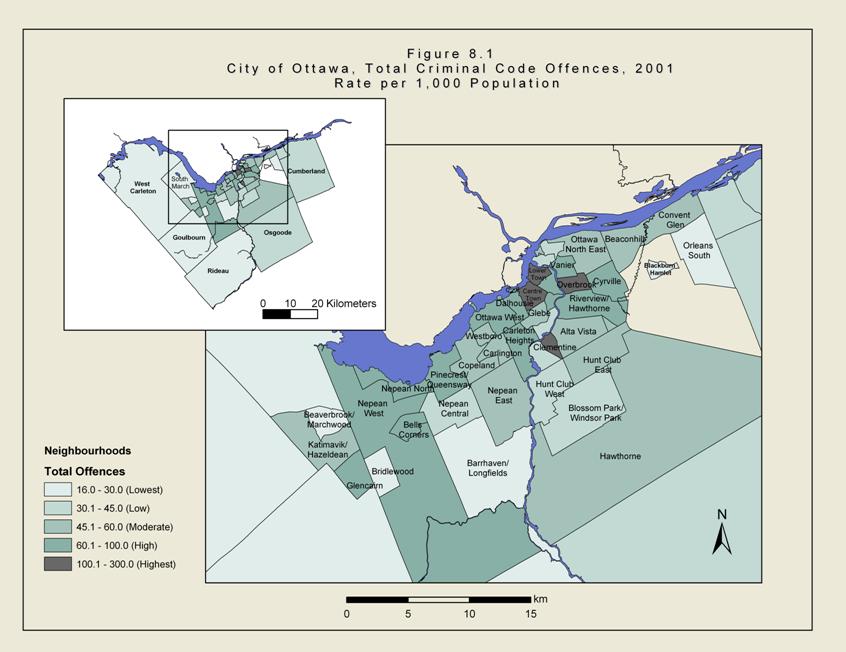
Figure 8.1 - City of Ottawa, Total Criminal Code Offences, 2001, Rate per 1,000 Population
Text Version
Neighbourhoods with the lowest rates of total criminal code offences (16.0 to 30.0) are highlighted by the lightest green, neighbourhoods with low rates of total offences (30.1 to 45.0) are highlighted by a light green, neighbourhoods with moderate rates of total offences (45.1 to 60.0) are highlighted by a medium green, neighbourhoods with high rates of criminal code offences (60.1 to 100.0) are highlighted by a dark green and neighbourhoods with the highest rates of criminal code offences (100.1 to 300.0) are highlighted by a darker green.
The map shows that the neighbourhoods with the highest rates of criminal code offences are found in the central core of the city. Neighbourhoods with high rates of criminal code offences are also found in the city core, as well as in the suburbs. The map also shows that the neighbourhoods with the lowest rates of offences are found in the rural parts of the city.
- Date modified: